I used Gabor filters to generate spectrograms of audio data. For the first part, I analyzed 9 seconds of the opening of Handel’s messiah using various window widths, window types, and translation step sizes and compared the results. For the second part, I analyzed a recording of the song “Mary Had a Little Lamb” as played by piano and as played by a recorder. For each recording, I generated a spectrogram and used the data from the spectrogram to derive a sheet music representation.
The full paper describing this project is here.
Gabor filtering provides a useful means to generate time varying spectrograms of time varying signals such as audio signals. The Gabor uncertainty limit demonstrates the tradeoff between high resolution in the time domain and high resolution in the frequency domain.
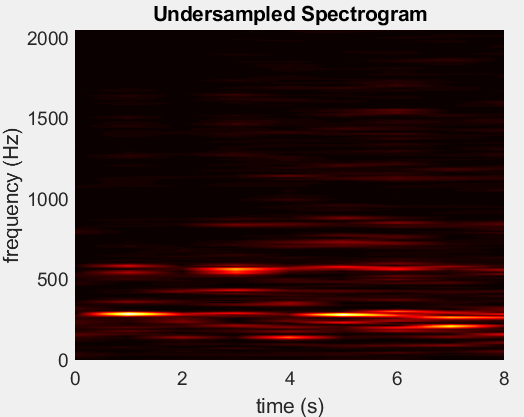
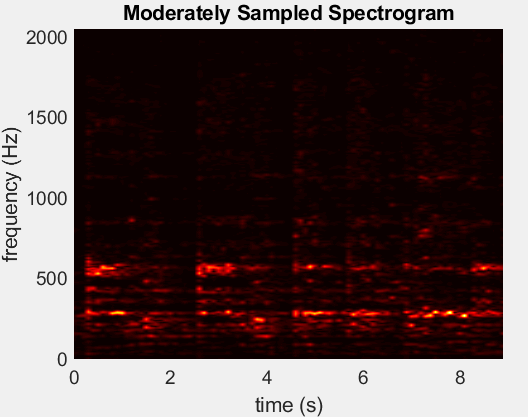
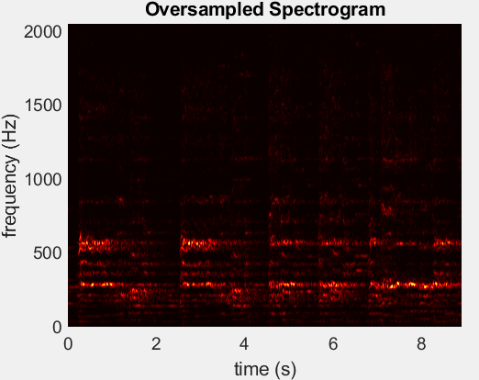
For the first part, the initial data was a MATLAB file in the form of a one-dimensional array of 73,133 values sampled at a rate of 8,192 Hz over a total duration of 8.928 s. I defined set of n=73,133 Fourier modes. I scaled the wavenumbers by a factor of for the FFT calculations, where L was then length of the audio data in seconds. For each spectrogram, I defined a Gaussian window, a Mexican hat window, and a rectangular window, and for each window, I generated a spectrogram for three values of the translation step.
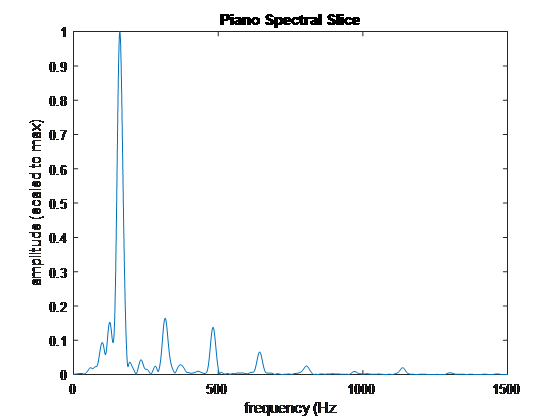
For the second part, the initial data included two wav files, one with a piano sampled at a rate of 43,840 Hz over a total duration of 16 s and one with a recorder sampled at a rate of 44,837 Hz over 14 s. For each audio file, I generated spectrograms using a Gabor transform with a Gaussian window to analyze the frequency content to identify the fundamental frequencies of each instrument for each note of the song, and from this information, I generated a sheet music representation of the song.