My first project with the CERN ATLAS Group was a training exercise to build my own Monte Carlo simulation. The Monte Carlo simulation is built on the assumption that a highly energetic particle will decay into two particles. The first particle will scatter by an angle theta and an angle phi relative to the initial trajectory of the parent particle. The angles are governed by probability distributions p(theta)=1/(1+theta) and p(phi)=1/(1+ phi). Each angle is determined stochastically. The first particle will then have an energy which is a fraction z of the initial energy E. From these values we can determine the trajectory of the second particle based on relativistic energy and momentum conservation. The first and second particles then decay in the same manner. The simulation assumes that once a particle reaches an energy Ecrit, it will no longer decay. This value is initially determined in the simulation.
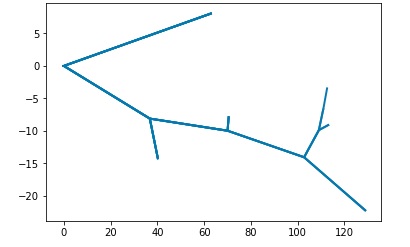
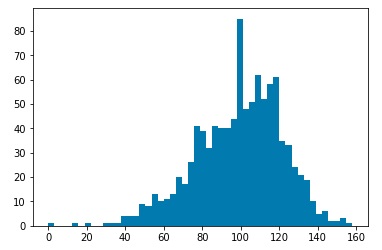
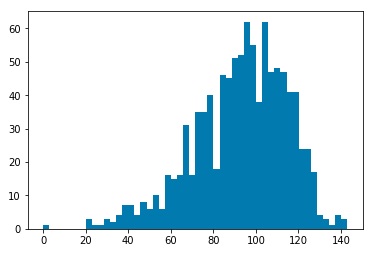
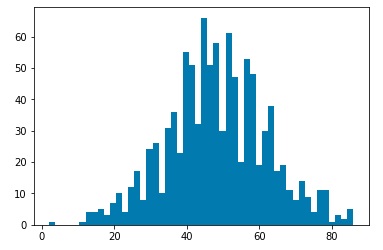
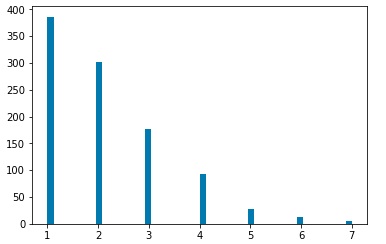
After simulating the decay processes, each particle will be characterized by momentum components Px, Py, and Pz as well as an energy value. We will assume that a detector has measured these values. Then we may use a clustering algorithm to cluster various measurements into “jets.” I used three common clustering algorithms, the kT clustering algorithm, the Cambridge-Aachen algorithm, and the anti-kT algorithm. Clustering may be characterized by a factor n, and a factor R. The factor n determines which algorithm we are using. The kT algorithm corresponds to n=1, the Cambridge-Aachen algorithm corresponds to n=0, and the anti-kT algorithm corresponds to n=-1. The R value is a tuning parameter. Typical values are in the range of 0.4 o 0.7. For my investigation, I ran clustering for R=0.01, 0.05, 0.1, 0.5, and 1.0. For each set of values n and R, I ran 1000 simulations, and plotted histograms of the number of jets clustered by the corresponding algorithm.
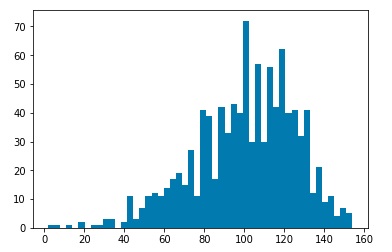
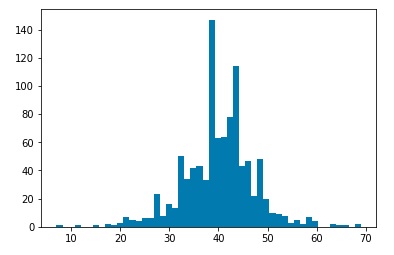
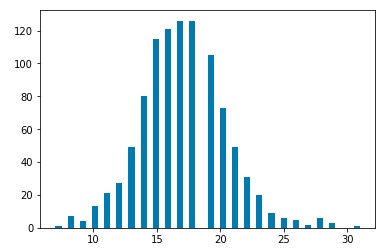
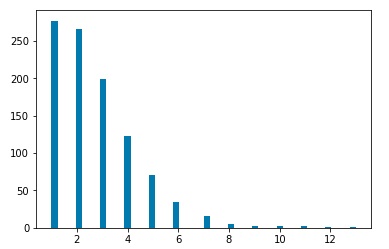
Plots for kT Clustering algorithm, R=0.01,0.05,0.1,0.5, 1.0
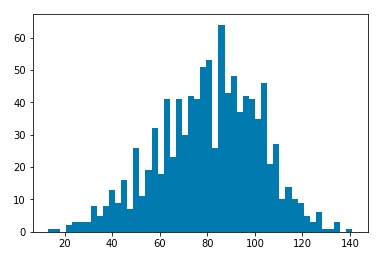
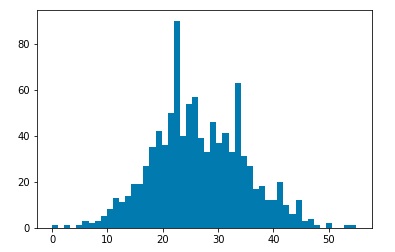
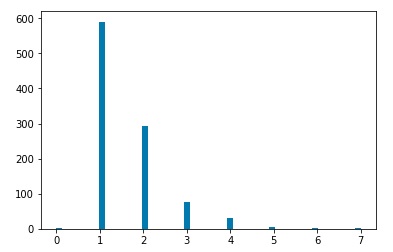
Plots for Cambridge-Aachen clustering algorithm, R=0.01,0.05,0.1,0.5, 1.0
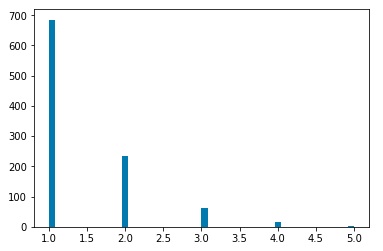
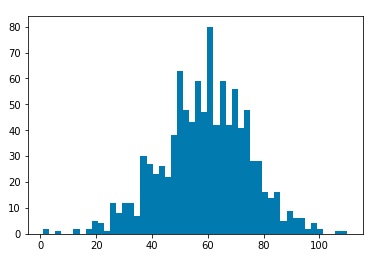
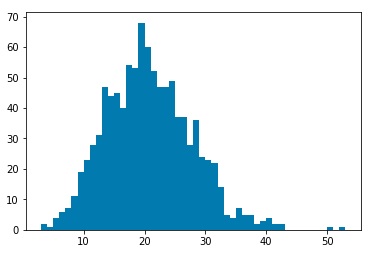
Plots for Anti-kT Clustering algorithm, R=0.01,0.05,0.1,0.5, 1.0